ブックタイトル鉱山2020年11月号
- ページ
- 7/44
このページは 鉱山2020年11月号 の電子ブックに掲載されている7ページの概要です。
秒後に電子ブックの対象ページへ移動します。
「ブックを開く」ボタンをクリックすると今すぐブックを開きます。
このページは 鉱山2020年11月号 の電子ブックに掲載されている7ページの概要です。
秒後に電子ブックの対象ページへ移動します。
「ブックを開く」ボタンをクリックすると今すぐブックを開きます。
鉱山2020年11月号
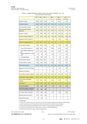
不許複製???????????????????????????????????????????????????????????????????????????????????????????????????????????????????????????????????????????????????????????????????????????????????????????????????2017 2018 2019 % 2020 % 2021 % 2022 %p/ Forecast ForecastWorld Mine Capacity 23,993 24,062 24,139 24,784 25,931 27,154World Mine Production 20,058 20,565 20,528 -0.2% 20,446 -0.4% 21,784 6.5% 23,071 5.9%World Concentrate Production 16,284 16,668 16,573 -0.6% 16,554 -0.1% 17,771 7.4% 18,839 6.0%World Concentrate Production(adjusted 3/)16,284 16,668 16,573 -0.6% 16,388 -1.1% 17,254 5.3% 17,722 2.7%Electrowon Production 3,774 3,898 3,955 1.5% 3,874 -2.1% 4,013 3.6% 4,233 5.5%Electrowon Production (adjusted 3/) 3,774 3,898 3,955 1.5% 3,835 -3.0% 3,897 1.6% 3,982 2.2%Adjustments for Mine Production 3/ -223 -633 -1,368World Mine Production (adjusted 3/) 20,058 20,565 20,528 -0.2% 20,223 -1.5% 21,151 4.6% 21,704 2.6%Percent Capacity Utilization 84% 85% 85% 82% 82% 80%Primary Feed for Refineries 1/ 15,889 16,229 16,164 15,989 16,773 17,252Primary Refined Production exclEWDifference Refined Prod. - PrimaryFeed15,711 16,126 16,062 16,841 17,504 17,942177 103 102 -852 -731 -691Accumulated Balance 596 699 801 -51 -731 -691Primary Refined Production 19,485 20,023 20,017 20,715 21,517 22,175Secondary Refined Production 4,063 4,035 4,028 3,808 4,145 4,391World Refined Production 23,548 24,058 24,045 -0.1% 24,523 2.0% 25,662 4.6% 26,566 3.5%Adjustment for Primary Feed Shortage -51 -731 -691Adjustment for Electrowon -39 -117 -251Primary Refined Production (adjusted) 19,485 20,023 20,017 0.0% 20,625 3.0% 20,670 0.2% 21,234 2.7%World Refined Production (adjusted) 23,548 24,058 24,045 -0.1% 24,434 1.6% 24,815 1.6% 25,625 3.3%Percent Scrap in Total RefinedProduction17.3% 16.8% 16.8% 15.6% 16.7% 17.1%World Usage 2/ 23,705 24,484 24,427 -0.2% 24,486 0.2% 24,745 1.1% 25,424 2.7%World Refined Balance -156 -426 -382 -52 69 201World Refined Balance Adjusted forChinese Bonded Stocks Change 5/-154-485-560Four Weeks of World Consumption 1,823 1,883 1,879 1,884 1,903 1,956Reported Stocks End of Period 4/ 1,375 1,227 1,220Reported Stock Change 10 -148 -7p/ preliminary data1/ Assumes a 97.5% copper recovery rate for copper content of concentrate and 3 weeks of working stocks for adjustment of pipeline changes.2/ Apparent consumption is used for the European Union instead of the accumulation of the individual countries' consumption3/ For Forecast years, allowance for supply disruptions based on average ICSG forecast deviations for preceding 5 years4/ Refined stocks include those held in the exchanges, producers, consumers, merchants and governments5/ Estimated Chinese bonded stock changes; averaged from multiple sources????????????????????????????? ?????? ?????????????????出典:国際銅研究会2020年10月総会統計資料Data source:International Copper Study Group, October 2020--鉱山第789号2020年11月